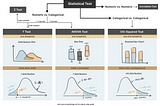
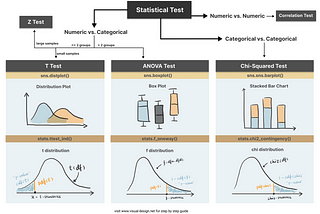
PinnedDestin GonginTowards Data ScienceAn Interactive Guide to Hypothesis Testing in PythonT-Test, ANOVA, Chi-Squared Test with ExamplesApr 15, 20227Apr 15, 20227
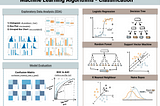
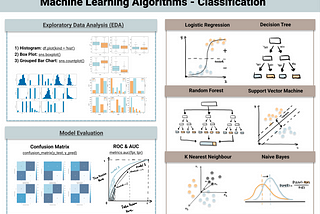
PinnedDestin GonginTowards Data ScienceTop 6 Machine Learning Algorithms for ClassificationHow to Build a Machine Learning Model Pipeline in PythonFeb 23, 20227Feb 23, 20227
PinnedDestin GonginTowards Data ScienceHow to Self-Learn Data ScienceA Project Based Approach to Get Started in Data ScienceJan 31, 20225Jan 31, 20225
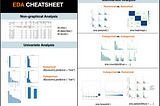
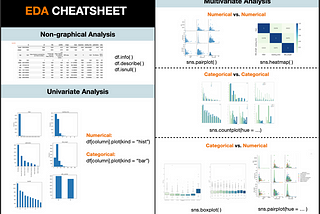
PinnedDestin GonginTowards Data ScienceSemi-Automated Exploratory Data Analysis (EDA) in PythonComprehensive Data Exploration Process with One-ClickMar 1, 20219Mar 1, 20219
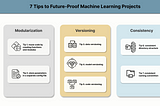
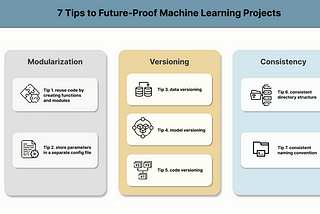
Destin GonginTowards Data Science7 Tips to Future-Proof Machine Learning ProjectsAn Introduction to Developing More Collaborative, Reproducible and Reusable ML CodeFeb 242Feb 242
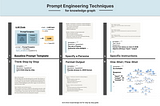
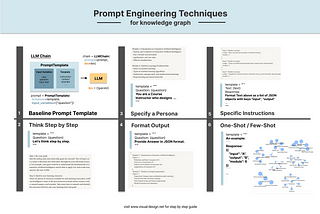
Destin GonginLevel Up CodingA Simple Pipeline for Integrating LLM Prompt with Knowledge Graph6 Steps of Prompt Engineering for Knowledge Graph IntegrationJan 16Jan 16
Destin GonginTowards Data ScienceHow to Develop a Streamlit Data Analytics Web App in 3 StepsStep-by-Step Guide to Build Your First YouTube Analytics AppFeb 25, 20231Feb 25, 20231
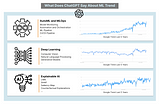
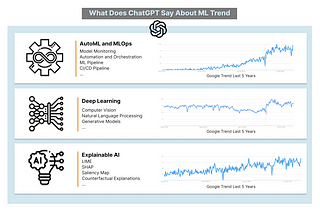
Destin GongWhat Does ChatGPT Say About ML Trend and How Can We Prepare For It?A curated list to get your hands on MLOps, Deep Learning, XAIFeb 11, 2023Feb 11, 2023
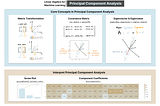
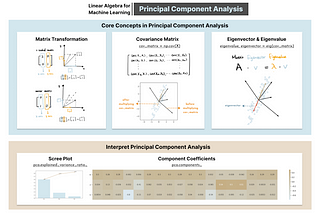
Destin GonginTowards Data ScienceA Visual Learner’s Guide to Explain, Implement and Interpret Principal Component AnalysisLinear Algebra for Machine Learning — Covariance Matrix, Eigenvector and Principal ComponentJan 25, 20233Jan 25, 20233
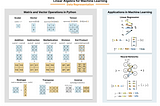
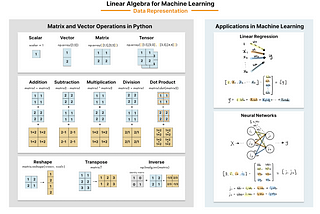
Destin GonginTowards Data ScienceLinear Algebra for ML | Matrix, Vector and Data RepresentationStarting from using matrix and vector for data representationDec 30, 2022Dec 30, 2022